 Transport mapping: emotional cartography, mobility and the body politics of place
Abstract
This paper outlines an approach to researching transport mobilities through the visualisation of social data by mapping of movement and experiences in place. Drawing on Creswell’s (2006; 2010) framework for a “politics of mobility”, Sheller and Urry’s notion of the “new mobilities paradigm” (2006), and Harding and Pribram’s (2002) approach to historicizing emotions through their contextualization, digital mapping is used to draw out social and emotional aspects of transport mobility in a local place context. This reworking of geographic spaces highlights social motivations and individual experiences as influences within a broader understanding about the generation of a range of movement for transport mobility studies. Following from Nold’s (2009) work in emotional cartography, and Del Casino and Hanna’s (2006) theory of “map spaces”, the paper describes a pilot research case study titled the “Transport Mapping” project where a mapping event is used to capture a range of place details and emotional responses linked to a specific place context. The project is a conducted at a university community based in Western Sydney, a fast growing urban region with sprawling urban infrastructures. As a result of the mapping process, a unique geographic space is rendered and represented with reference to a range of human subjectivities and body politics. Opportunities for dialogues between researchers and respondents at such an event are shown as an important catalyst for capturing emotional and social mapping data.
Creswell’s (2006; 2010) work on the centrality of transport mobility and the need to further investigate the space it occupies is succinctly expressed in his six points for a “politics of mobility” (2010). These points provide a useful framework for evaluating the emotional mapping responses from this pilot study towards a body politics of place, as an affective geography. As a result of this evaluation, some additional points are proposed to add to Creswell’s mobility framework. These highlight the immediacy of personal experience and emotional responses to local contexts of transport mobility for research into alternative and affective body politics of place.
Introduction
The creative possibilities inherent in mapping that were described by Corner (1999) have been more recently explored by a range of theorists including Dodge and Kitchin (2007), Kitchin, Dodge and Perkins (2009) and Del Casino and Hanna (2005). Calls for understanding and conceptualising mapping practices as emergent forms of assemblage and future thinking require new approaches to how mapping is understood as a practice, and also its potential role as a research tool or method. This cultural turn offers exciting possibilities for how mapping might be used to research transport mobility issues within local contexts, by combining the science of geospatial visualizations with more affective emotional and narrative responses to transport related experiences. Similarly, the cultural turn in transport mobility studies offers a “new mobilities paradigm” (Sheller & Urry, 2006: 208) that highlights the need for a more in depth engagement with the significant role of movement.
Our approach brings together recent scholarship from transport geography (Kwan, 2007; Shaw & Sidway, 2011; Thien, 2005); ICT’s and geography (Lyons, 2009; Propen, 2006; Stopher, 2009); the role of the social within mobility studies (Creswell, 2006; 2010); the “new mobility paradigm” (Sheller & Urry, 2006); and digital mapping practices (Nash, 2000; Dodge, Perkins & Kitchin; 2009), to begin a useful dialogue about the value of affective social data as context-specific representations of emotional landscapes for mobility studies. Similarly, the work of Jones and Evans (2011) highlights the value of qualitative research using GIS methods, describing their “spatial transcript” technique that “offers valuable insights into the ways that space and mobilities are co-constructed” (Jones & Evans, 2011:1). As a critical practice, we propose that the mapping of emotional and social features of local transport journeys can inform a renewed politics of place that sits within a larger global context of urban movement, as an engagement with the “new mobilities paradigm” (Sheller & Urry, 2006; Shaw & Hesse, 2010). As Hall (2009) comments, this spatial turn offers new ways to engage with the local as a setting for qualitative investigations.
The practice we describe takes place in the form of a mapping event, where respondents and researchers explore details of spatial journeys through mapping as drawing for exploring greater detail about social mobilities in place. Initially, we outline the practice of emotional cartography, and then describe our pilot study, the “Transport Mapping” project. We evaluate some of the initial findings about the emotional and affective politics of transport mobility and their potential value to the field of transport mobility as a means through which to visualize and represent aspects of the affective and social dimensions of mobility in place.
Emotional cartography – an alternative “body politic of place”
Emotional Cartography (Nold, 2009) is an emergent field of mapping that offers the possibilities of engaging people in gathering affective and emotional data. Nold’s Bio Mapping device is a mobile wearable recording instrument, built from a skin sensor, Global Positioning System (GPS) and data logger. The sensor device measures sweat levels on the skin as an indication of emotional intensity, whilst the GPS provides the geographical location of where these events occur. A participant goes for a walk in their local area with the device and on their return can visualise the data as a three- dimensional track, whose varying height indicates the arousal in different locations. Sitting together with a group of local people, the walker then uses the emotional data to make sense of their journey and talk about specific events that occurred and how they made them feel. Since the walker, as well as others present, all know the area, the walker's narrative creates a group discussion about particular local sites. These conversations are then recorded textually on the map.
By repeating these walks with large numbers of people in one location, Nold uses the information to create collective emotion maps of the area. The collated data sets shed light on relational and affective engagements with space and place, carried out around specific projects and places, creating “ a tangible vision of places as personal sensations which we are not normally aware of” (Nold, 2009: 10). Bio Mapping is one example of emotional cartography, that opens up the affective qualities of spatial journeys, and can shed light on relational networks and patterns of both human and non-human elements that exist within communities as people move about in their everyday lives. Nold suggests that Bio Mapping is an “inversion of the lie detector, which supposes that the body tells the truth, while we lie with our spoken words” (Nold, 2009: 5).
Nold’s work in emotional cartography often takes place as projects working in site specific contexts, such as forms of intervention into that community, using the emotional data that has been gathered through Bio Mapping and other tools to measure and track mobility. One example of this is the Bijlmer Euro mapping project that involved documentation of the circulation of tagged Euro notes in a local community of shops. The intention of this mapping assemblage is to reveal the circulation of currency as flow and network towards enabling the sustainability of a local communities social economy. The focus on mobility in the data evaluations from this project reveals new insights about how patterns and flows of mobility take place. Nold comments on the Bijlmer Euro mapping project’s value in identifying unique connections of flow within the data, linked to the community context of exchange, production and consumption, and the potential for intervention into the community to support future social enterprise initiatives:
There are 2000 Bijlmer Euro notes that can be used at 17 participating local shops to get special discounts. Each Bijlmer Euro has a unique electronic chip which means you can see where they are being used. The evolving visualisation will enable local people and shop keepers to see how money is moving in their local area, something which is totally unique in the whole world. Fundamentally the visualisation allows anyone to identify purchasing and movement patterns, making it possible to draw conclusions about the use of the currency and the benefits for the local shops.
For example, we may find that money is moving from a gym in the Bijlmer to the local bakery and back again. Perhaps this is because people are exercising and then at lunch time going and buying their sandwich at the bakery and then returning back to the gym. That sort of pattern might suggest a symbiotic relationship between local business. In this example both enterprises could co-operate for mutual benefit by selling sandwiches directly at the gym. Another example could be that the money is flowing between two shops who sell similar goods. This will indicate that people are going to a number of different greengrocers not just one. That would suggest that both shops might want to talk to their customers about stocking a wider variety of goods or perhaps specialising. We may also find that money is not moving between two shops that could benefit from the mutual custom. This might be in incentive for the shop owners to discuss with their customers about setting up some co-operative offers (2010: http://www.bijlmereuro.net/?lang=en ).
http://www.bijlmereuro.net/?page_id=15&lang=en
shows the form of this mobility mapping as flows of tagged Euro notes being exchanged between the shops involved. The size of lines within the circle of shops indicates the strength of exchanges taking place across the network. As he suggests, these become points of departure for social and cultural insights about the nature of the network as dynamic and constantly changing and evolving, and that could be further explored to promote intervention for social benefit as a practice of designing. Nold’s suggestions for possible design intervention seek to enrich the existing community by identifying such points of intersection and exchange thus contributing to social wellbeing, resilience and community cohesion. This mapping highlights the specificity of selecting place and time as a multiplicity of performances of people and things in processes of exchange through mobility in place. Nold’s Bijlmer Euro mapping project is one example amongst others that explores the dynamics of movement through a close study of inter-connected elements linking people with places and spaces in meaningful contexts. As Nold comments, the process challenges formal notions of representational mapping, suggesting an alternative “body politic of place”:
But, perhaps, the most important aspect of Emotional Cartography is the way in which it creates a tangible vision of places as a dense multiplicity of personal sensations, which we are not normally aware of. The complexity and diversity of these experiences presents a fundamental challenge to all our formal notions of representational politics. Furthermore, the bottom-up process of identifying communal matters of concern, starting from personal sensations, suggests the possibility of an alternative body politic of place (Nold, 2009: 10).
Nold’s depiction of such an alternative “body politic of place” is one where emotions seep through the boundaries of public/private space, impacting and shaping power relations. Harding and Pribram give a critique of how emotions can be historicized and thus contextualised as what they term “structures of feeling”:
To historicize emotions means to radically contextualize them by locating them in and across specific time periods and cultural spaces within relations of power and resistance. Historicizing the emotions entails ceasing to understand them as isolated personal experiences or as prewired intuitive, instinctual or gut responses set off by specific stimuli. It is, instead, to reimagine them as structures of feeling, as competing values of power and meaning operating in complex circuits of social, cultural and individual relations. To historicize is to give presence to that which lies ‘a little beneath history’ (Foucault cited in Sawicki, 1991: 28), just under the surface of the publicly acknowledged world. Emotions as a category of experience exist just beyond the reach of history, as do the lives of those who have come to represent emotional experience (Harding & Pribram, 2002: 425).
Harding and Pribram’s call for an emotional re-imagining towards “structures of feeling” provides a critical framing for finding new ways to engage with emotional and affective investments, to explore how ideologies are internalised and naturalised (Grossberg, 1984).
The “Transport Mapping” project explores and critiques emotional structures that are embedded within and linked to the movement and mobility of transport journeys. The field of transport geography calls for greater research into the place of emotions and affective investments within transport studies (Shaw and Hesse 2010). Shaw and Sidway (2011) reflect on the “place, perception, reception and prospects of transport and transport geography in human geography” (2011: 504), and Sheller and Ury (2006) call for a “new mobilities paradigm” that engages more fully with social, cultural and experiential relations of travel and human movement. Cresswell (2010) proposes a “politics of mobility” framework for transport geography that draws attention to the production of political economies through systems of movement, thus linking the production of political economies to underlying aspects of mobility across the spectrum of human and non-human, including emotion, rhythm, feeling and a variety expressions of movement.
Creswell’s “politics of mobility”
Creswell’s’ ‘politics of mobility’ highlights an unpacking of mobility as ‘an entanglement of movement, representation and practice’ (Creswell, 2007: 17). His approach engages with movement through explorations of the experiential and social aspects of transport involving social relations, gender, ethnicity, and cultural nuances in the production and distribution of power:
To recap, I want to develop an approach to human mobility that considers the fact of movement, the represented meanings attached to movement, and the experienced practice of movement. Taking all these facets seriously I argue, will help us delineate the politics of mobility. And this is important, as there seems little doubt that mobility is one of the major resources of 21st century life and that it is the differential distribution of this resource that produces some of the starkest differences today
Creswell’s approach to a “politics of mobility” emphasises the dynamics of movement involving both human and non-human elements, with six key elements in his framework, that seek to engage with a range of forces and factors that influence mobility:
Why does a person or thing move?
How fast does a person or thing move?
In what rhythm does a person or thing move?
What route does it take?
How does it feel?
When and how does it stop? (Creswell, 2010: 22-26)
Creswell’s description of these six elements provides a useful methodological framework for exploring issues of mobility within transport studies encompassing aspects of economic, class, hierarchies of access and opportunity, routes that connect and disconnect regions and environs. His critique suggests that these six mobility elements relate to a wider agenda about the place of social justice in understanding the politics of mobility. Creswell thus highlights mobility as a key platform of modernity, increasingly ‘dromological’ in a regulatory era of computational information (Virilio, 1986), shifting focus away from local to global via logistical thinking.
Dromology is the regulation of differing capacities to move. It concerns the power to stop and put into motion, to incarcerate and accelerate objects and people. The model for this new mode of regulation is logistics … The spaces from which this mobility is produced are frequently the spatial arrangement of the database and the spreadsheet (Creswell, 2010: 28).
Whilst the spreadsheet or database extracts logistical data effectively in order to represent it as movement and flow, the nuances of distances and relations between more embodied human elements and expressions of place, space and movement are not often included in these computational representations. Creswell’s six elements of mobility are oriented around the need to include more affective and explorative nuanced forms of data that inform and shape transport systems and cultures, alongside logistical representations. Del Casino and Hanna describe this separation of on the one hand, logistical data, and on the other, affective and relational data, as reproducing “at least implicitly, a series of binaries that separate maps as representations of space from spatial practices” (Del Casino & Hanna, 2006: 35).
Maps as performative and affective representational practices
Del Casino and Hanna offer a methodological framework for moving beyond such binaries of what they term “representation/practice, production/consumption, conceptualization/interpretation, and corporeality/sociality” (Del Casino & Hanna, 2006: 35) seek a more critical approach to cartography as a theory of “map spaces” – to be both “representations and practices (read performances) simultaneously” (Del Casino & Hanna, 2006: 36). Drawing on the work of Butler (1993; 1997) and Nash (2000), they suggest that all spaces are:
always already representations that are produced by and productive of a myriad number of bodily practices and performances as social actors draw on their intertextual knowledges while reauthoring both space and representation simultaneously (Del Casino & Hanna, 2006: 41).
Their case example about the notion of “map space” describes a tourist map of historic Fredericksburg, USA. Their critique details the consumption of this map by tourists, and its value for tour guides as a basis for place-based narratives in a variety of settings. They note how the simple map product acts as a sensory prompt for the experience of the tourist reminding them of their visit. In this way, they suggest that maps are always incomplete, needing to be consumed in order to be re-produced.
Kwan also calls for a far greater engagement with geospatial technologies (GT) and practices in order to reintroduce a range of subjectivities, emotions, feelings, values and ethics into practice. Drawing on feminist theory, she highlights the importance of embodied geospatial practices that are:
… attentive to the effects of emotions, which mediate the social and political processes through which our subjectivities are reproduced (Harding & Pribram, 2002; Bennett, 2004). This not only involves reintroducing long-lost subjectivities of the researcher, the researched, and those affected by GT back to geospatial practices, but also involves making emotions, feelings, values, and ethics an integral part of geospatial practices (Kwan, 2007: 23).
Kwan (2007) highlights the role of the researcher as potentially an active participant in research endeavours with reference to GT projects such as the Amsterdam Realtime Project (Propen, 2006). This art-based GT project takes an approach similar to Nold’s “emotional cartography” by collating personalized data of participant movements in real-time through a city space. In this project, the participants were the researchers themselves, thus creating a breakdown of the binary between participant and researcher. As suggested by Del Casino and Hanna (2006), this and other mapping approaches have the impact of disturbing binary distinctions between “author and reader, subject and object, performance and representation”, as what they term as the “map space”. The dialogues between researchers and respondents were shown to be a key factor in the pilot project, as described below.
The “Transport Mapping” pilot project
The value of experiential data in transport studies about mobility preferences by end users has already been shown to be of significance in researching transport behaviours. A recent study (Brereton, Roe, Foth, Buys, 2009) analyses the success of car-pooling strategies, showing the imperative of effectively addressing end-users concerns with social aspects of the experience such as privacy, safety, convenience in order to get on board with carpool schemes. In their study of car pool communities, individual, personal and experiential factors were identified as being most directly related to shifting patterns of behaviour in car pool communities. They conclude that these factors are most likely to be satisfied or addressed through small-scale, interpersonal, mobile and locative information dissemination and intervention in order to change behaviours and cultures.
The “Transport Mapping” project specifically sought to gain and disseminate new knowledge about the emotional and social aspects of the University of Western Sydney (UWS) community’s transport usage. The above theories provide a framework for introducing and evaluating the pilot stage of this Transport Mapping project that was carried out with the university community as a mapping event. In the long term, the project’s intention is to provide greater insight about the problems and concerns inherent within transport systems and behaviours across the geographic region of Western Sydney.
Transport has been clearly identified as an area for improvement by university surveys of students and staff. Transport is generally acknowledged as a significant problem for the overall region of Greater Western Sydney that has become to rely heavily on the road system, in the absence of good public transport infrastructures. The NSW Transport Plan (2010) provides an emphatic data imperative for the need to reduce car journeys and to develop a more flexible, integrated set of commuter journey options for the Western Sydney region. WSROC (Western Sydney Region of Councils) reports:
As a city of 1.85 million people, Western Sydney is larger than the capital cities of Perth and Brisbane, and Australia‘s largest non-capital city which is the Gold Coast. Western Sydney‘s population is expected to reach 2.93 million in 2036, a substantially faster rate of growth than the rest of the greater Sydney area. The greater metropolis of Sydney is in many ways two cities in one. There is the coastal city stretching from Newcastle to the Illawarra, and the inland city of the plains and the adjacent towns of the Blue Mountains (WSROC, 2010: 1).
The importance of transport and in particular, developing viable alternative commuter options is seen as a key priority by both authorities and residents in Sydney, compounded by significant projections of future construction and urban growth:
The failure to adequately plan for and fund these road networks, together with the ongoing failure to provide critical public transport and rail infrastructure means the people of Western Sydney will soon literally not be able to move. Already there are 1.9 million people in the Greater Sydney region who mainly rely on cars to get around. Over the next 20 years we are expected to take in another 1 million people. These people will literally not be able to move unless the incoming Government commits to building an integrated transport network in and around our region. Already 70 per cent of people in the northwest region rely on their cars to get to work. They are already three car families. And yet this is the same area which has been designated as the site of at least 100,000 new homes under the current Metropolitan Strategy. (WSROC, 2011, ‘Western Sydney Grinding to a Halt’, March 23, Media Release)
The UWS campuses are spread over a wide area, with the student population sourced widely across the entire Greater Sydney area, meaning the reliance upon personal transportation – i.e. cars - is significant (which presents significant infrastructural burdens upon the university, i.e. parking, which is already at a critical level, with little possibility of further investment beyond its current capacity and pressured by increasing student numbers).
Whilst investigating the nature of the hard problems the university faces in student transportation and the types of data that the institutional bodies has already collated, it was noted that there was limited knowledge of personal and interpersonal transport behaviours amongst the university community. Thus the Transport Mapping project was established to begin to explore this space, and to find ways to gather such experiential data, with a view to then informing the university about further options to improve existing systems, to change behaviours and cultures of travel to and from the university. Using Nold’s emotional cartography as a point of departure, the project took as a starting point that the success of infrastructural strategies aimed at re-shaping behaviour or culture are ultimately predicated on information exchanges between the university institution and its community. The project thus seeks in the longer term, to generate a significant contribution to knowledge about the mobilities of this community. Similar to Nold’s work on mapping mobility using emotional cartography, it also seeks to suggest strategies as forms of future design intervention, that could help improve the mobility for this particular community, by pinpointing key intersections of exchange, production and consumption around transport mobility.
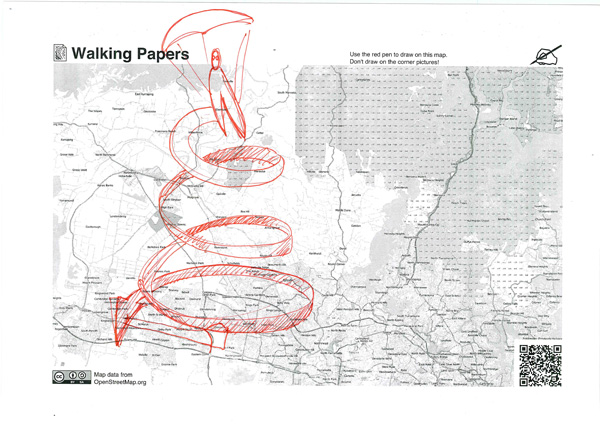
The pilot project was established around an understanding of Nold’s emotional cartography as a means through which to gather affective and emotional data about the university community’s transport mobility issues to and from campus. The project uses the Sensory Journeys software (2009) developed by Nold which allows people to draw and visually annotate their commuter journeys by hand on printed maps. The software uses the Walking Papers component to allow the printing of paper maps that have a QR code which uniquely identifies their geographical location and zoom level. When participants used a red pen to draw and annotated their journeys on the paper maps, their drawings can be scanned in order for the software to extract the red drawing from the grey map and project it into an online GIS tool. This tool allowed participants to include their hand written and drawn emotive articulations that can then be entered into a public shared map interface record of their journey and mode of transport.
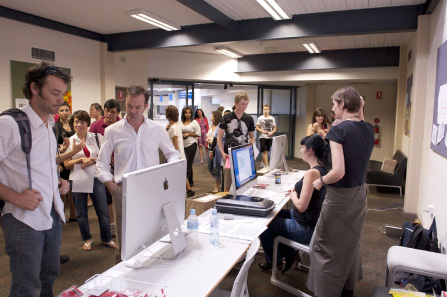
The mapping event took place as a form of ‘kiosk’ where university student and staff were invited to record their experiences and emotions on hard copy maps, responding at the same time to a series of questions about their mobility to and from campus on that specific day. shows the event on the day set up in a public space adjacent to other activities at the university’s Orientation Day.
The method of data gathering is shown in where the hard copy paper maps are scanned and uploaded to the Sensory Journeys software for display on Open Street map. These multiple entries highlight points of interest, feelings, concerns, and experiences of place on that particular day that are linked to particular and specific elements of place.
The questions provided to respondents at the kiosk ask specific details about the journey such as mode of transport to the campus. Respondents could choose from a variety of zoom levels of the paper maps that covered their journey in Western Sydney. Many respondents chose to draw close up details about their route directly from the rail station to the campus, noting emotional and physical elements. Others chose to draw on maps that covered a much greater spatial area, thus reducing the amount of detail that could be provided.
The approach taken in this mapping event seeks to draw out a range of responses about mobility and the role of personal and social motivations for why decisions are taken to travel in a particular way, feelings about the journey, the time taken and the route itself. The questions in were given to respondents as specific prompts to begin their drawing. These questions are similar to Creswell’s six points for his “politics of mobility” framework, as prompts seeking to delve beneath the surface of how journeys are experienced, without being too leading, or directive.
The Significance of interactions between researchers and respondents
During the mapping event, the researchers worked as facilitators to provide and explain the project’s intentions, and to guide people to the optimum zoom level map for each respondent. These conversations and interpersonal dialogues broke down the binary between researcher/ respondent, leading to new insights about how mobility and social practices of movement to and from the campus could be further researched. In addition to the kiosk event, at a later time the same map sheets were handed out during a geography tutorial in a classroom environment where students filled them in without a researcher engaging them in discussion. All together the respondents from both sessions produced 120 maps with a marked difference between the maps created at the kiosk and in the classroom. Whilst the responses created in the classroom tended to be simple lines drawn on the maps to indicate the route travelled as well as points to indicate changes in mode of transport, in contrast the maps created in the social setting at the kiosk are much richer containing a number of additional layers of annotation and visual narrative forms and elements. This was largely the result of the interactions and exchanges between researchers and participants, as well as the social atmosphere of the kiosk setting compared to the more static classroom.
Evaluating the Data - Creswell’s six points for transport mobility
Using Creswell’s framework, we align our selected map responses to his six points in order to show how emotional and expressive responses can inform an understanding about the politics of transport mobility. Our approach highlights the role of emotions working within complex social and personal relations.
Why does a person or thing move?
The mapping process revealed that as well as the obvious aim for students to get to university, transport journeys often also include a strong social motivation, with many of the drawings featuring two people on forms of transport or walking together; with some maps showing people diverting by long distances to pick up or drop off friends motivated by social and friendship interest. In we have quotes from two friends who travel together allowing us to see the journey from both their separate points of view. The importance of discussing the geographically distant Thailand experience seems central to their experience of the journey.
How fast does a person or thing move?
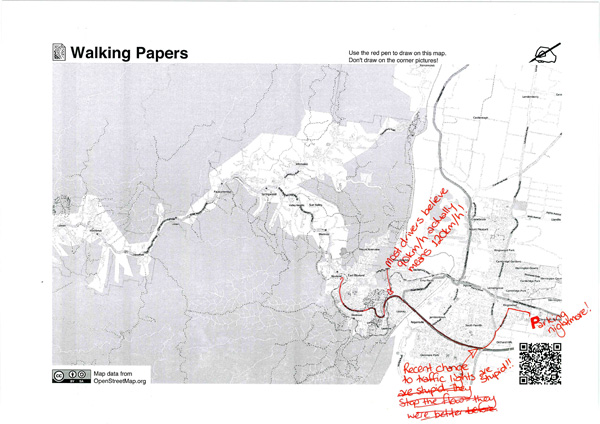
Speed and time are elements that feature heavily on the maps with many of the maps being demarcated into different speed zones and segments. The range of visualisations of movement in the maps includes train tracks and lines as representations of speed and continuity. Speed is described both numerically, as “110km/h”, “90km/h” as well as in subjective terms such as “fast”, “not so fast” as well as in time blocks such as “4 hour trip”. Speed descriptions are often used to complain about particular issues such as “Mamre Road needs to be 90km/h not 80km/h” or “Took 15 min to find parking”; “Trains only come every hour. But lots of buses to UWS”; “Road works wasn't that meant to be finished three weeks ago?!” and "I travel by car takes 1 hour. Long and boring. Lots of highways”.
These responses show how speed can be understood as a conceptual personal space that can be measured through emotional reactions to the environment, that often include assessments of speed in terms of events and experiences, not just linear time. The comments in show how speed can be understood in terms of driver reactions to road rules and signage - thus speed is a concept for behaviour linked to specific places.
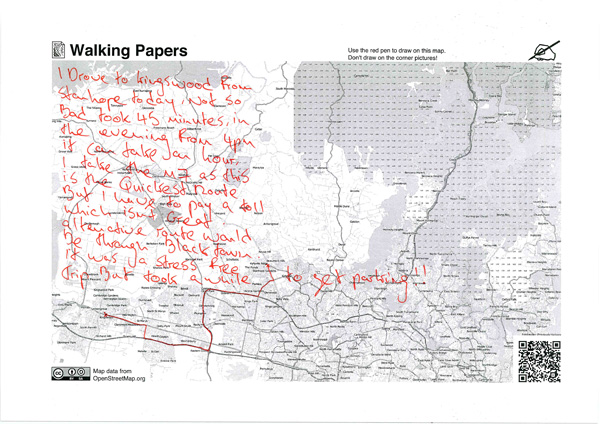
We interpreted rhythm in the sense of how the maps captured a larger or smaller slices of events with multiple dynamics. So driving to university in one map is conceived as a ‘Start Sign’ at their home and ‘End Sign’ at university with a drawing of a car with the text: "Pumped music ... singing along”. Rhythm in this sense is a singular continuous burst in a bubble type environment. For others their interchanges of transport seem to be linked to rhythm and flow of the journey – for example: “I drove to Kingswood from Stanhope today not so bad took 45 minutes. In the evening from 4pm it can take an hour. I take the M7 as this is the quickest route but I have to pay a toll which isn’t great. Alternative route would be through Black Town.”
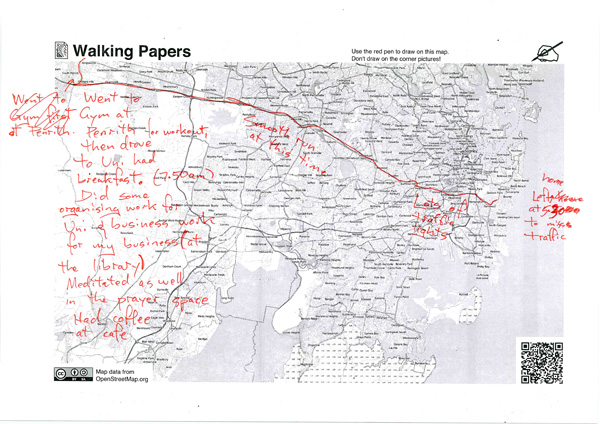
The maps seemed to allow people to express their whole daily rhythm in a clear way as in : “Left at 5:30 to miss traffic. Lots of traffic lights. Smooth run at this time. Went to Gym at Penrith for work out. Then drove to uni. Had breakfast (7:50). Did some organising work for uni and business work for uni and business work for my business at the library. Meditated as well in the prayer space. Had coffee at cafe.”
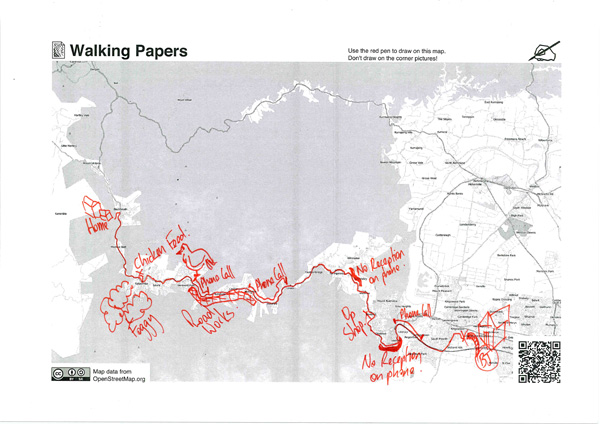
shows another form of staccato rhythm regulated by the availability of phone reception along the way: "Home. Chicken Feed. Foggy. Phone Call. Roadworks. Phone Call. No reception on phone. Op Shop. No reception on phone. Phone Call. University"
What route does it take?
In our study, we knew that all participants were travelling from their point of departure (mostly home) to the university campus. The size of the university catchment region meant that many students travel across a large geographic region using road, train, and bus routes. In some instances, students were travelling across non-linear pathways in order to make travel connections, not just going in the shortest distance. These non-linear pathways provide insight into the complexities that can arise when existing timetables and routes are indirect. For example, “Catch a train from Hazel Brook to Penrith. Change trains because CityRail sucks and Mountains trains don't stop at Kingswood”.
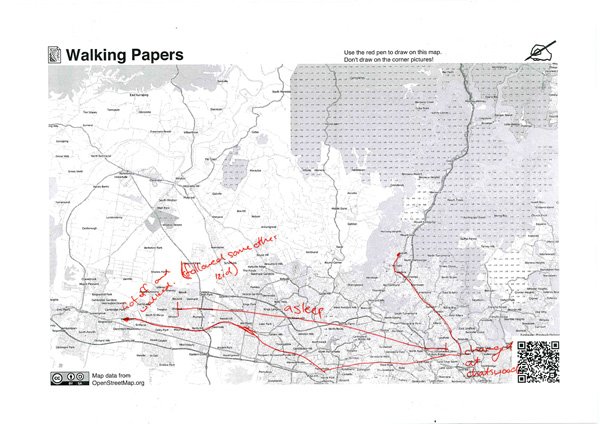
In the morning journey route is compared to the extra time taken in the evening, as a “stress free” trip” but that parking was hard to find. In , the route is made up of train and walking, with each journey segment described in terms of personal activity – ‘sleeping’, “follow some other kid.” This example suggests that whilst the train route is known, the route from train exit to campus is unknown and thus the student follows others assuming they know the route.
How does it feel?
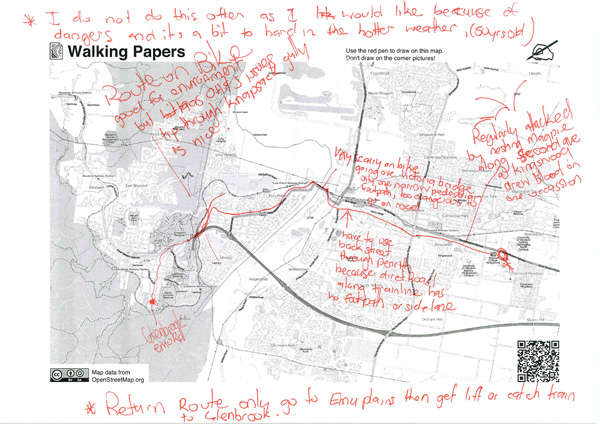
Our pilot study highlights the ways in which individuals attach emotive meanings to points along the route. Responses include drawing themselves with a speech bubble saying “Lost”; a speech bubble coming from car: “so bored”, “Slow car in right hand lane holding up traffic flow. Frustrating!” Place is shown to play an important role in how feelings are expressed, linked to activities such as mobile phone coverage, food outlets, sightings of animals, incidents such as car accidents and moments when they feel tired and bored. Of significance is the way that movement, places and incidents are often linked with a bodily sensation and emotion. “No parking had to drive around unfamiliar backstreet to find a place to park. Despite paying for a parking permit”, “Walking was a bit cold and I am feeling a bit tired because I got my wisdom teeth out yesterday”; “… Hope this bus arrives …”, “… Just follow everybody else…”. These kinds of response give a sense that mobility in itself is an experience that makes them feel insecure and out of control. shows a series of feelings about bicycle mobility linked to the experience of the journey, including the comment “Very scary on bike going over Victoria bridge only one narrow pedestrian footpath, too dangerous to go on road.”
When and how does it stop?
Our participants all stop at the final destination of the campus. For many new students, this would have been their first encounter with the campus. Many commented on the lack of parking at the site, as something that was not expected. For these students, their journey after finding the campus continued as they tried to find a park near the campus.
“Stopped on the highway and had to walk across the open grass to building BB just in time for our orientation”, “Walked to building from carpark. No parking anywhere!!” “I drove couldn't park anywhere. Parked on grass.” “Forced to park illegally.” The points when changing between forms of transport also become important as stages of a journey: “Start Journey. Filled up petrol. Stop and get coffee. End destination.” Stopping points are always important interruptions that feature heavily in people's experience of the journey.
Adding to Creswell's criteria - finding playfulness, humour and personal narratives
The alignment of responses with Creswell’s six points above reveals the role of emotions in defining a politics of place mobility. The kinds of human interaction with the transport environment described by the respondents paints a rich and lively picture of the region’s mobility profile, where social, cultural and individual relations and emotions are engaged often in the form of playfulness and humour. In evaluating the pilot mapping data, our study proposes three additional points to add to Creswell’s framework for transport mobility. These are:
- What are the significant events for you?
- How do movement constraints make you feel?
- How much creativity or personal autonomy is possible?
These three points highlight the immediacy of personal experience and emotional responses to local contexts of transport mobility, with some examples provided below. In describing and visualising emotional responses and experiences, a depth of detail around social, cultural and individual relations reveals how individuals feel empowered or not; how they identify places by markers and transport as shaped by limits and constraints. The visual references used in expressing these emotional aspects are powerful representations of Pribram and Harding’s (2002) emotional “structures of feeling”.
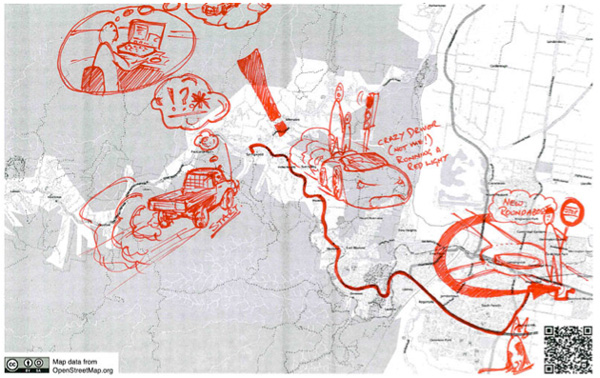
What are the significant events for you?
A series of one-off incidents or events were identified from the pilot study maps. These were often represented as points of personal narrative tension in the map drawings such as speed linked to frustration of traffic delays, problems finding parking on the day, alongside comments such as:
- “Burning car”
- “Polluting truck high exhaust”
- “Struggling Cyclist”
- “Broken down car”
- “Dog ran on road"
- “Ambulance sped past”
- “Car accident”
Seeing a struggling cyclist might not register for some people but for a fellow cyclist the event might be a personally significant part of their journey. Similarly, seeing a dog run on the road might be more memorable for those with pets than others. The experience of passing a car accident would no doubt raise a range of different and individual anxieties and concerns.
How do the movement constraints make you feel?
A range of comments about the limitations and interactions with the environment were given, highlighting mobility being affected by physical infrastructures. People respond to these in emotional ways, making statements and comments that are definitive opinions and statements. “Recent change to traffic lights are stupid” ;“Finding parking at uni on first day is terrible”; “Parking worse then shopping centre on Thursday night”; “Parking near my lecture was shocking @ 12:30am”; “Regularly attacked by nesting magpies along second avenue at Kingswood drew blood on one occasion.” From our study, we found that these “out of control” external constraints seem very important to people's travel experiences.
How much creativity or personal autonomy is possible?
This point of creativity and autonomy refers both to the travel experience as well as the research method. Using the Sensory Journeys tool with its grey maps that people were encouraged to draw on seems to give people the licence to find an appropriate visual form for representing their travel experience. Many participants used the linear journey as a cartoon strip with themselves seen from the outside as a visual narrative. Visual examples also include drawing showing a performativity in representing themselves asleep on the train as seen by fellow passengers. Others went further and added playful and cryptic comments such as “Found narnia here”, demonstrating a sense of fantasy and adventure associated with transport mobility. Others created playful drawings of large feet, cars, and steam trains in children's adventure book style drawings. The texts accompanying images are also often expressive.
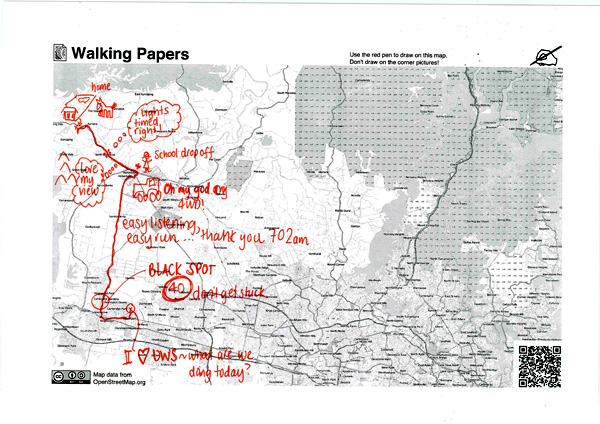
shows a series of expressions in a creative written way – “Home. Lights timed right! Love my view. School drop off. Oh my god my 4WD! Easy listening, easy run … thank you 702AM. Black spot 40km, don't get stuck. What are we doing today?”
, and show uses of symbols and metaphors to describe journeys through geographic that take the map as a surface upon which to draw – each example provides a symbolic sense of the emotional journey across the geography. These examples reveal the importance of creativity and autonomy while travelling. It seems that for the participants, being able to freely disrupt the grey Cartesian map with one’s own personal story seems to be both engaging for them to participate in the research project, as well as highly productive for articulating the emotional experiences of their journeys as connection, action and relationship.
Conclusion
The findings from the pilot “Transport Mapping” project resulted in a range of experiential data linking mobility with place and time. The mapping event explores what Del Casino and Hanna term a “map space”, which represents spatial understandings and place-based mobilities as both “representations and practices (read performances) simultaneously” (Del Casino & Hanna, 2006: 36). As a method, emotion mapping is found to be very engaging for people as a way to become involved in a mobility research project, enabling capture of a crucial affective dimension, which could be supplemented with logistical and quantitative transport data. The fact that the resulting affective drawings are geo-referenced, allow them to be imported into a GIS package for overlaying with over quantitative data.
The pilot study thus far has produced findings that provide a far greater understanding of the challenges of university campus travel, for the dispersed student community in the region of Western Sydney. The study draws attention to the importance of personally significant events, movement constraints and the role of creativity and autonomy for transport studies, and highlights the value of emotion mapping as a research method for transport mobility.
References
Bennett, K. (2004). Emotionally intelligent research Area. 36 (4), 414-22.
Brereton, M., Roe, P. Foth, M., Bunker, J. & Buys, L. (2009). Designing Participation in Agile Ridesharing with Mobile Social Software OZCHI 2009 proceedings: Design University of Melbourne.
Butler, J. (1997). The Psychic Life of Power: Theories in Subjection. Stanford, CA: Stanford University Press.
Corner, J. (1999). The Agency of Mapping: Speculation, Critique and Invention, in D. Cosgrove (ed) Mappings. London: Reaktion.
Dodge, M. & Kitchin, R. (2007). Rethinking Maps. Progress in Human Geography. Vol. 31 (3), 331-344.
Creswell, T. & Merriman, P. (eds) (2010). Geographies of Mobilities: Practices, Spaces, Subjects Ashgate: London.
Creswell, T. (2010). Towards a politics of mobility Environment and Planning D: Society and Space. 28, 17-31.
Creswell, T. (2001). The production of mobilities. New Formations. 43, 12-36.
Del Casino, V. & Hanna, S. (2006). Beyond the Binaries: A Methodological Intervention for Interrogating Maps as Representational Practices ACME: An International E-Journal for Critical Geographies. 4(1) 34-56.
Dodge, M., Perkins, C. & Kitchin, R. (2009). Mapping modes, methods and moments: manifesto for map studies. In M. Dodge, Kitchin, R. & Perkins, C. (eds.). Rethinking maps: new frontiers in cartographic theory. Routledge: London, pp. 220-243.
Hall, T. (2009). Footwork: moving and knowing in local space(s) Qualitative Research. 9: 571
Harding, S. & Pribram, E.D. (2002). The power of feeling: Locating emotions in culture European Journal of Cultural Studies. 5: 407-26
Independent Public Inquiry: Sydney’s Long Term Public Transport Plan 2010 Accessed from http://www.transportpublicinquiry.com.au/
Jones, P. & Evans, J. (2012). The spatial transcript: analysing mobilities through qualitative GIS Area 44. 1, 92-99.
Kwan, M. (2007). Affecting Geospatial Technologies: Toward a Feminist Politics of Emotion The Professional Geographer. 59:1, 22-34.
Lyons, G. (2009). The reshaping of activities and mobility through new technologies. Journal of Transport Geography. 17 81-82.
Nash, C. (2000). Performativity in practice: some recent work in cultural geography Progress in Human Geography. 24(4) 653-664
Nold, C. (2010). Bijlmer Euro Mapping project, Accessed from http://www.Bijlmereuro.net/?lang=en
Nold, C. (Ed). (2009). Emotional Cartography Technologies of the Self Accessed from http://emotionalcartography.net/
NSW Government Bureau of Transport Statistics at Statistics, Accessed from http://www.transport.nsw.gov.au/tdc.
Propen, A. (2006). Critical GPS: Towards a new politics of location. ACME. 4(1) 131-44.
Sawicki, J. (1991). Disciplining Foucault: Feminism, Power and the Body. New York: Routledge
Shaw, J. & Hesse, M. (2010). Transport, geography and the ‘new’ mobilities. Transactions Royal Geographic Society (with the Institute of British Geographers) NS 35.
Shaw, J. & Sidway, J. D. (2011). Making links: On (re) engaging with transport and transport geography. Progress in Human Geography. 35(4) 502-520, 305-312.
Sheller, M. & Ury, J. (2006). The new mobilities paradigm. Environment and Planning. A 38207- 226.
Stopher, P.R. (2009). Collecting and Processing Data from Mobile Technologies. in Transport Survey Methods. Emerald
Thien, D. (2005). After or beyond feeling? A consideration of affect and emotion in geography. Area. 37 (4) 450-56.
Urry, J. (2007). Mobilities Polity: Cambridge.
Virilio, P. (1986). Speed and Politics: An essay on Dromology New York: Columbia University.
WSROC Getting Western Sydney Going Financing the infrastructure needs of Western Sydney 2010 http://www.wsroc.com.au/images/stories/getting ws going report.pdf
WSROC 2011, Western Sydney Grinding to a Halt, Mar 23 Media Release http://www.wsroc.com.au/index.php?option=com_content&view=article&id=166:western-sydney-grinding-to-a-halt-mar-23&catid=30:2011-march-media-releases-&Itemid=7
About the authors
- Urban Research Centre, University of Western Sydney
Louise is an urban geographer who focuses on issues of sustainability and affordability. Her work includes the interfaces between property and citizenship, models of de-commodifed property, innovative housing, urban food systems and participatory mapping methodologies.
- Extreme Citizen Science Group, University College London.
Christian is an artist, designer and researcher working to develop new participatory methodologies and technologies for communal representation. In 2009 he edited the book "Emotional Cartography - Technologies of the Self" and in 2011, co-wrote the book “The Internet of People for a Post-Oil World”. Nold is currently a PhD researcher in the Extreme Citizen Science Group at University College London.
- School of Humanities & Communication Arts, University of Western Sydney
Kaye is Associate Professor in design and visual communication in the School of Humanities and Communication Arts at UWS. Current projects include mapping as a participatory practice of critical visualisation of transport mobility and urban food systems.
- University of Western Sydney
Jason is a member of the Writing and Society Research Group at the University of Western Sydney. His current research interests include epistemology, subjectivity and Deleuzean theory. He is currently engaged in a doctoral thesis on Art and Nature.